- OP token has formed a bearish head and shoulders pattern, said Ali Martinez.
- If the pattern plays out, OP could retest the $0.95 – $1.00 support level.
- Investors should watch out for increasing volumes and a sharp retracement below the support level.
Optimism (OP), a major layer 2 cryptocurrency project, might be headed for a massive price decline. That’s because the altcoin has formed a well-known bearish pattern called the ‘head and shoulders.’ If the pattern holds true, the digital asset could drop to the $1 price level sometime soon.
According to a post on X (formerly Twitter) by crypto analyst Ali Martinez, the OP/TetherUS perpetual contract chart on Binance (seen below) has formed a Head and Shoulders pattern. The left shoulder formed when OP first rallied before dropping back. The head took shape when the price climbed to a higher peak of around $1.2, only to fall sharply afterward.
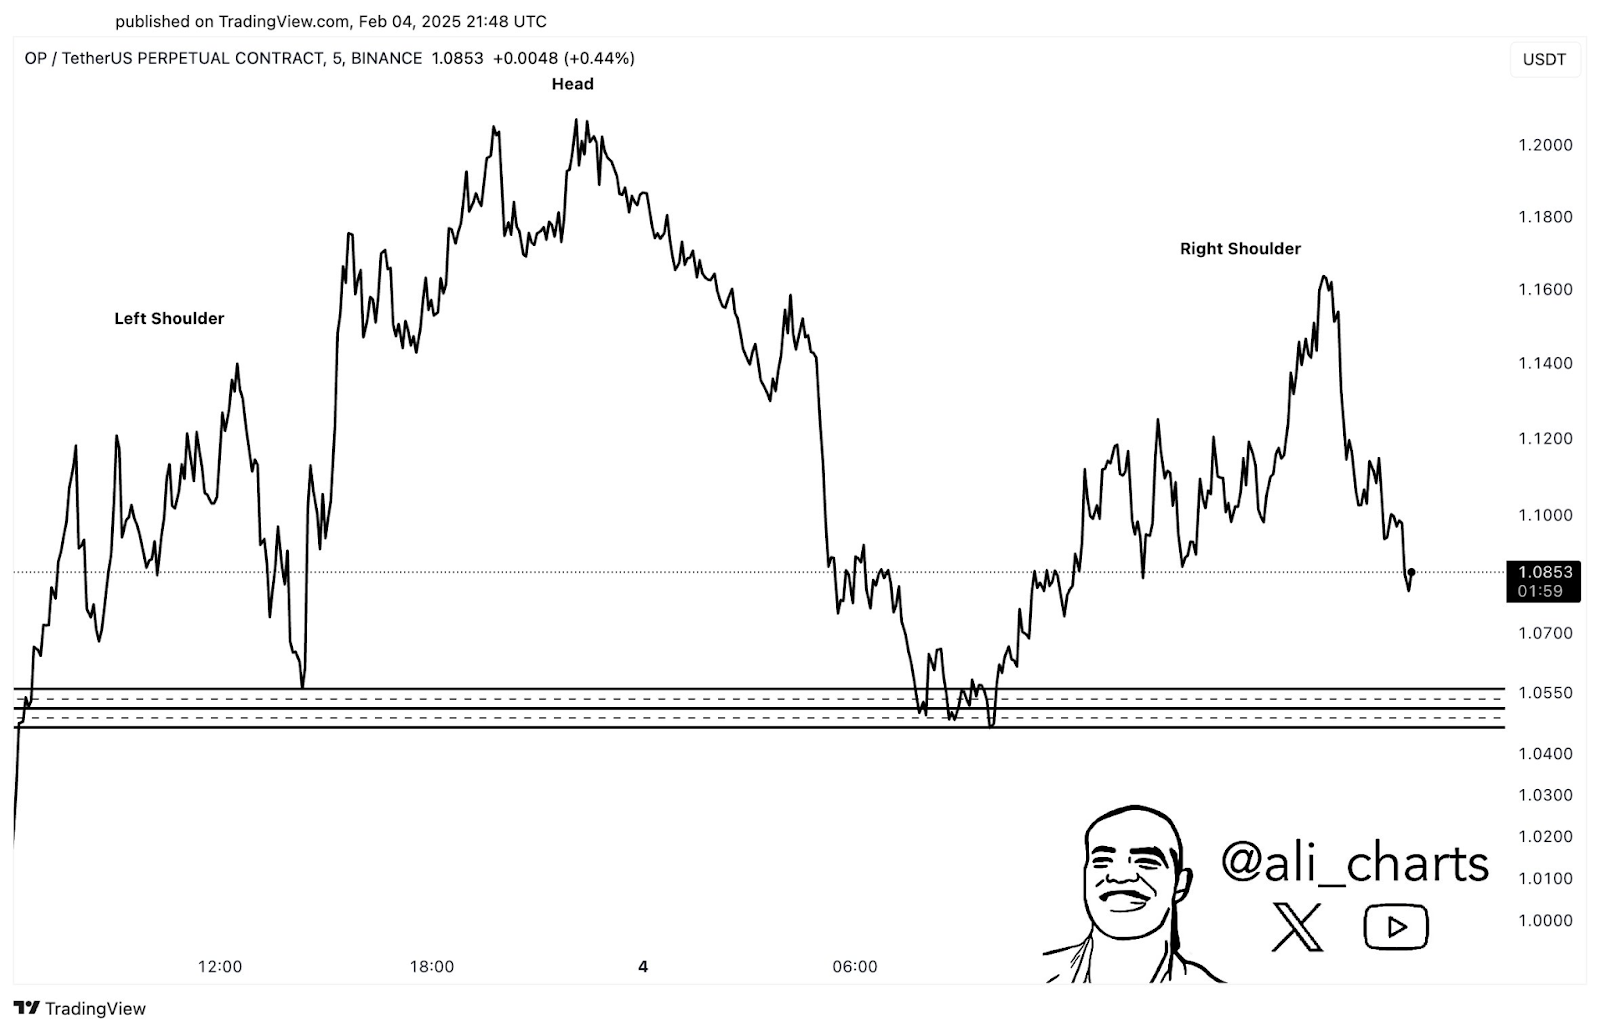
Next, the right shoulder showed up with a weaker rally, unable to go higher than the head, suggesting decreasing bullish momentum. The neckline seems to be around the $1.05 – $1.07 range. If OP breaks below this level with strong volume, it could trigger a sharp decline, possibly dropping to lower support zones around $1.00 or lower.
It’s worth noting that the target of such a pattern is equal to the distance from the head to the neckline, which could push OP towards $0.95 – $1.00 if the breakdown happens. OP needs to stay above the neckline and move higher to avoid this bearish pattern.
Related: Top Solana Projects Ranked—Will These Tokens Lead the Next Altseason?
OP Price: What’s Next?
At the time of this writing, OP is trading at $1.11, up 1.43% in the past day. But, the altcoin has dropped a substantial 22.48% in the last seven days and 47.80% in the past month, CoinMarketCap data shows.
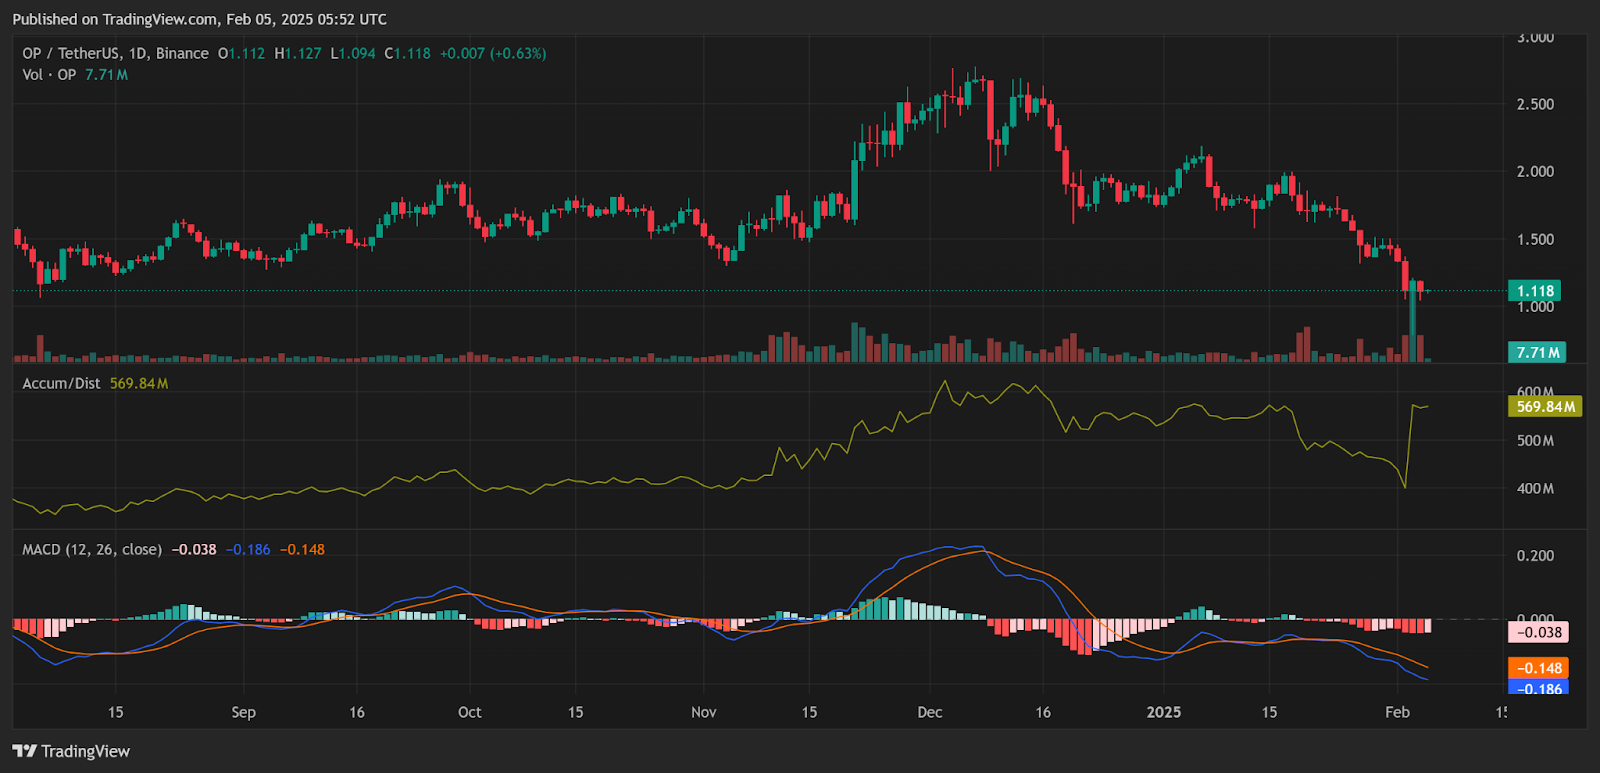
The daily chart below shows that the accumulation of OP has spiked. This suggests that bulls are buying the recent dip, and a reversal could be seen in the coming days.
Related: Analyst Slams Retail Traders for Missing Early Crypto Calls
However, on the flip side, the MACD indicator looks bearish for OP, with the MACD line (blue) staying below the signal line (red). The MACD histogram is also red, indicating that bears are controlling the OP token’s price action.
Disclaimer: The information presented in this article is for informational and educational purposes only. The article does not constitute financial advice or advice of any kind. Coin Edition is not responsible for any losses incurred as a result of the utilization of content, products, or services mentioned. Readers are advised to exercise caution before taking any action related to the company.